Project -: Horizon View - How to get a report of the max concurrent connections / day
Horizon View Version -: 7.10
As many of you know , Horizon View is missing a native reporting feature.
Those who are interested, you can try Horizon Toolbox Fling at the link below, which would give you some additional features
https://flings.vmware.com/horizon-toolbox-2
This includes a graph of max concurrent connections / day, which is very interesting.
It wasn't quiet what I was looking for as I needed numbers and it was hard to get it from the graph when you chose a higher time frame from the dropdown here.
When I used this fling, it was asking for credentials to connect to View Event DB. So what's positive is the data I am looking for is somewhere there in the MS SQL DB :)
Did a google search and ended up in the KB below
https://kb.vmware.com/s/article/2089816
I was really happy, but that didn't last for long. This KB is not applicable for View 7.X. I gave it a try anyway, but the SQL Query mentioned there didn't work.
After digging a lot we found the SQL Table and altered MS SQL Query. Below is the MS SQL Query ran against
View_Events DB that worked for us and a screenshot of the how the output looks like
SELECT TOP 50 sum(vedh.IntValue) AS [Count], veh.Time as [Time] FROM VEevent_data_historical vedh JOIN VEevent_historical veh ON vedh.EventID = veh.EventID WHERE (vedh.Name = 'UserCount') GROUP BY veh.Time ORDER BY veh.Time DESC
Now that's what I wanted :).
This MS SQL Query will get you data which's like an End Of the Day report which Max. number of user connection / day.
But we didn't stop there. We decided to display this data in an web page and I will explain how we did that in the part 2 of this blog post.
If you are happy running MS SQL query when ever you want this data, you may stop here :)
Part 2 - How to setup a Web Page to display this data
Main reason for this was to make this data avilable for the management.
I decided to use PHP as my choice of code, simply because my past experience in it and I could find a lot of examples out there in the web.
I decided to host this webpage in my Win10 VDI machine
Requirements
>> Required to install IIS on the box
>> Then we need to setup PHP on the box
>> Needs an ODBC connection to MS SQL Server hosting View_Event DB. We need a service account created in SQL for this.
Lets start...
a) Install IIS
1) Open Programs and Features from Control Panel
2) Click on Turn Windows features On or off
3) Install IIS with defailt feature + select CGI as one additional option
b) Install PHP
1) Download latest PHP Windows from here
2) Extract the .zip file to a Directory of your choice. I decided to go with "D:\php"
3) You can find file "php.ini-development" under the above directory. Make a copy of it and name it as "php.ini"
4) Open "php.ini" file in a text editor and search for below entries (in bold) one by one. Once you find it, remove the ";" before the line to un-comment and update it's values as below (in Blue)
error_log = "php_errors.log"
open_basedir = "C:\inetpub\wwwroot"
extension_dir = "D:\php\ext"
cgi.force_redirect = 0
cgi.fix_pathinfo = 0
fastcgi.impersonate = 1
and
Search for "Dynamic Extensions" in the file and add below extentions there after last commented line, before the nex section which is "Module Settings"
extension=php_pgsql.dll
extension=php_odbc.dll
c) Configure IIS with PHP
1) Go to Start -> Run and Type "inetmgr" and enter
2) On the right panel, Open "Handler Mappings"
3) On the right most panel, under "Actions", click on "Add Module Mapping"
4) Create below mapping it to php-cgi.exe that's in our php folder
Request Path -: *.php
Module -: FastCgiModule from the drop down
Exectable -: D:\PHP\php-cgi.exe
Name -: FastCGI
d) Create a SQL User and Assign Read Permission to SQL DB
Create a new SQL User and assign Read Permission to the user in your Horizon View MS SQL Server.
UserName: reportsuer
Password: reportsuer
You may use AD authentication instead, or use a strong password. But then you need to update our php code which we will be create in Part 3 with the uname and password that you want to use.
e) Setup an ODBS Connection
Now let's go back to out "WebServer", which in my case is the Win10 machine where I have installed PHP and IIS
1) Start and Search for ODBC
2) I'm selecting ODBC 64 bit based on my machine
3) Create a new System DSN
4) Select SQL Server and Click Finish
5) Name "VIEWODBC"
Again - if you wish to change, you need to update the connection strign in the PHP code below.
6) Your choice of Description
7) Server -: FQDN or IP of the MS SQL Server hosting View_Event DB
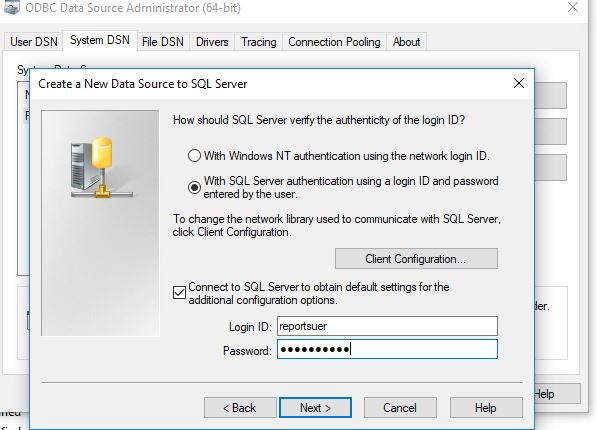
8) Next and careful at the next one. Because I created a SQL Server Authentication, I am choosing that and providing user reportsuer and password reportsuer
9) Again in the next page, Check the box which says "Change Default Database to" and select View_Events
10) Leave the rest in default setting and it's always better to test the connection at the end before you close.
Done with all configs required to run our small report Web page now :)
Part 3 - Test and then create our report web page
1) To test php
Open notepad and copy paste below lines to it
<html>
<body>
<h3>PHP Test Page</h3>
<?php
echo "PHP Test Page <br />";
?>
</body>
</html>
2) Save the file as Check.php
3) Copy the file in to C:\inetpub\wwwroot
Works and we are almost there :)
Now,
2) To test ODBC connection
Open out Check.php and add below (in blue) lines to it
<html>
<body>
<h3>PHP Test Page</h3>
<?php
echo "PHP Test Page <br />";
$db = odbc_connect("VIEWODBC", "reportsuer", "reportsuer");
print "ODBC connection established";
?>
</body>
</html>
2) Now you may test again and if all good, you can see below page
3) Now the most exciting part, let's host out Report web page.
Open a new notepad and copy paste below code to it and save it as Report.php.
after that move it to C:\inetpub\wwwroot like we did before
<head>
<title>View Session Report</title>
</head>
<body>
<table border="1">
<caption>Max Horizon View Connections per day</caption>
<tr>
<th>Max Connections
<th>Date
</tr>
<?php
$db = odbc_connect("VIEWODBC", "reportsuer", "reportsuer");
$stmt = "SELECT TOP 30 sum(vedh.IntValue) AS [Count], veh.Time as [Time] FROM VEevent_data_historical vedh JOIN VEevent_historical veh ON vedh.EventID = veh.EventID WHERE (vedh.Name = 'UserCount' and vedh.IntValue > '0') GROUP BY veh.Time ORDER BY veh.Time DESC";
$result = odbc_exec($db, $stmt);
if ($result == FALSE) die ("could not execute statement $stmt<br />");
while (odbc_fetch_row($result))
{
print "<tr>\n";
print " <td>" . odbc_result($result, "Count") . "\n";
print " <td>" . odbc_result($result, "Time") . "\n";
print "</tr>\n";
}
odbc_free_result($result);
odbc_close($db);
?>
</table>
</body>
</html
2) Once done, browse the page and test it :)
Above is the how the report page looks like!
You may also try accessing it from outside the PC by using
http://<hostname or ip>/Report.php
Update
If you look at the above report, there are two lines there which shows 0 connections. But if you look at the date, there's also a line below that with the same date and with correct number of sessions.
So I updated the MS SQL Query as below to remove these 0 entries.
SELECT TOP 30 sum(vedh.IntValue) AS [Count], veh.Time as [Time] FROM VEevent_data_historical vedh JOIN VEevent_historical veh ON vedh.EventID = veh.EventID WHERE (vedh.Name = 'UserCount' and vedh.IntValue > '0') GROUP BY veh.Time ORDER BY veh.Time DESC
Note -: Works for us because we have users everyday. In your case if there are days where 0 users login, this wont work and those days will be missing from the report. So be mind full when you update your Report.php with above MS SQL Query.